| Section 11
SEVERE WEATHER OUTLOOK CHART The severe weather outlook chart, Figure 11-1, is a 48-hour outlook for thunderstorm activity. This chart is presented in two panels. The left hand panel covers the first 24-hour period beginning at 12Z and depicts areas of possible general thunderstorm activity as well as severe thunderstorms. The right hand panel covers the following day beginning at 12Z and is an outlook for the possibility of severe thunderstorms only. This computer-prepared chart is issued once daily in the morning (about 08Z). LEFT PANEL A line with an arrowhead delineates an area of probable general thunderstorm
activity. When facing in the direction of the arrow, the thunderstorm activity
is expected to the right of the line. An area labeled "APCHG" indicates probable
general thunderstorm activity may approach severe intensity. "Approaching"
means, that at the surface, winds are greater than or equal to 35 knots, but
less than 50 knots; and/or hail greater than or equal to 1/2 inch in diameter,
but less than 3/4 inch at the surface. In Figure 11-1, from 12Z/25 MAR to 12Z/26
MAR, general thunderstorms are forecast for much of the southern half of the
country except for Tennessee and portions of Arkansas, Mississippi, Alabama,
Georgia, and the Carolinas. Note that the southern tip of Florida is not
included in the general thunderstorm forecast area.
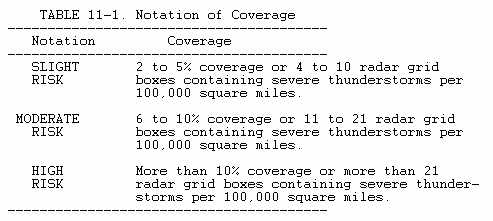
Severe Thunderstorms The hatched area indicates possible severe thunderstorms. Table 11-1 shows the risk of severe thunderstorms and possible coverage. In Figure 11-1, there is a slight (SLGT) risk of severe thunderstorms in portions of Texas and Oklahoma. RIGHT PANEL On this panel, only severe thunderstorms are forecast. As this forecast panel is beyond the initial 24-hour period, only areas of possible severe thunderstorms are outlined. No reference to the potential or coverage is indicated. In Figure 11-1, the right panel indicates the possibility of severe thunderstorms from Texas and Oklahoma across the mid and lower Mississippi River Valley into the Ohio River Valley. USING THE CHART The severe weather outlook is strictly for advanced planning. It alerts all
interests to the possibility of future storm development.
|